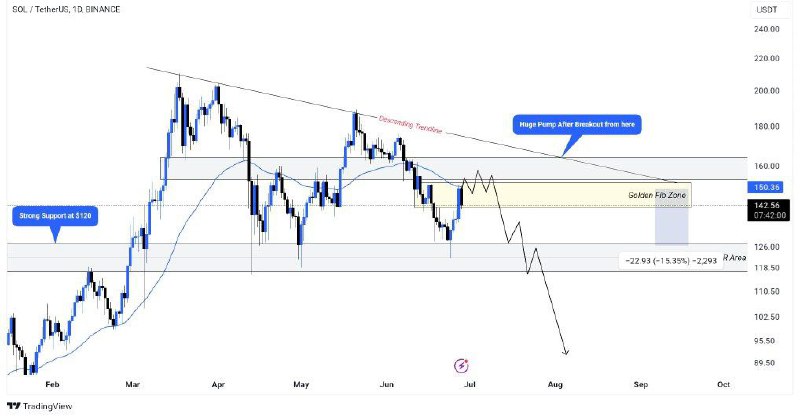
Everyone is Thinking right now that $SOL is about to go Sky High but but before you reach to conclusion just look at Solana's chart
After dropping about 40% from its peak. It bounced back up from the key support zone.
It's forming a Descending Triangle, it's a bearish pattern,
If this support breaks, we could see more downside. I've shown both bullish and bearish scenarios in the above chart.