2023-09-22 13:24:07
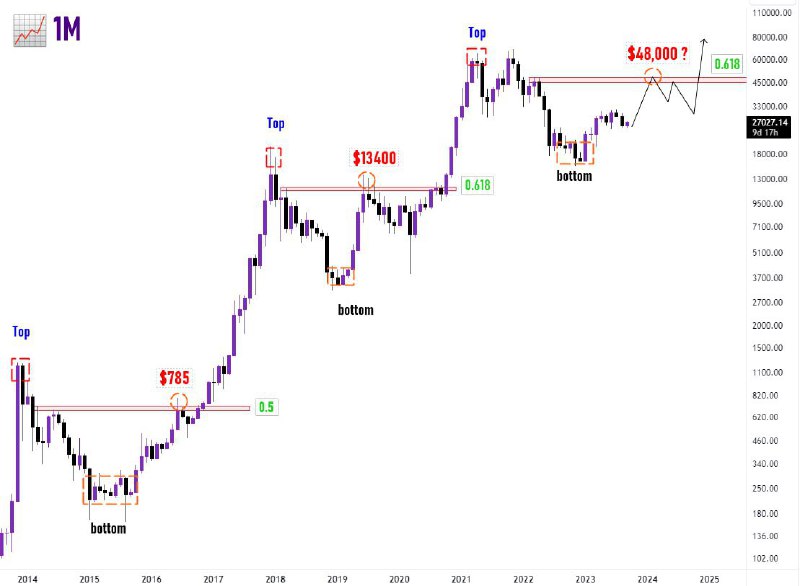
Analyzing the monthly chart of Bitcoin, there is a recurring pattern that is worth investigating.
Bitcoin price is often corrected by the resistance of two Fibonacci levels: the 0.5 and 0.618 levels.
In 2016, Bitcoin price rose to $785 and tested the 0.5 Fibonacci retracement level, but bounced back from it.
In 2019, we saw another rally to $13,400, right up to the 0.618 Fibonacci retracement level, and it bounced back sharply from there.
If we see a rally similar to 2016, it is conceivable that the price may reach around $42,000 (the 0.5 Fibo level) and correct from that level.
Also, if we experience a rally similar to 2019, we can predict that the price will correct from the 0.618 Fibonacci level to $48,000.
VIP
13.6K views10:24