Channel address:
Categories:
Cryptocurrencies
Language: English
Subscribers:
38.61K
Description from channel
Trading crypto for over than 6 years🤺. Now posting charts along with this, so plug in.
🧞♂️Interested in a well-prepared signals? Then pm me >> @AlbertcryptoN
🗣You have a good channel/project and want to show it? Also pm me >> @AlbertcryptoN
Ratings & Reviews
Reviews can be left only by registered users. All reviews are moderated by admins.
5 stars
1
4 stars
0
3 stars
2
2 stars
0
1 stars
0
The latest Messages 2
2023-12-08 16:37:12
#ETH/USD
Price shows a confirmed
falling wedge breakout that after
retesting upper border could signal a 91%
price increase
13.1K views13:37
2023-12-07 15:36:18
#MANA/USDT
breaking trend
resistance line
Upside to 1 dollar price is initiated
17.8K views12:36
2023-12-06 16:29:04
#TOTAL2
Altcoin total market capitalization
broke out of a 2-year trading
range Major altcoins could see
substantial gains soon if Bitcoin enters a
ranging period
21.9K views13:29
2023-12-05 15:24:05
#BTC/USD
Bitcoin is in a
bullish uptrend, having
broken out above an
ascending resistance The
uptrend is expected to continue as long as price trades above the
broken trendline
13.4K views12:24
2023-12-04 16:07:35
#BTC/USDT
$BTC surpassed the $40,000
resistance, testing $42,000 and securing a position above
The market cap of $BTC is now above $800 billion, ranking it 10th globally
The breakthrough indicates a possibility to reach $42,500 - $43,000 soon
Accumulation period expected after reaching those
levels
13.5K views13:07
2023-12-03 15:51:05
#USDT.D
breakdown the
symmetrical triangle pattern, pointing to a possible 7% price
decline
13.4K views12:51
2023-12-02 16:09:02
#BTC/USDT
Bitcoin is showing a
rising wedge pattern on the 4-hour chart
Price would need to
consolidate above the
resistance zone to
upswing 15% higher
14.9K views13:09
2023-12-01 15:20:18
#ETH/USDT
Price has been trading
sideways between $2,020 and $2,120
support and
resistance levels Breakout above $2,120 could trigger
rally to $2,200, $2,500 and $3,000
levels
14.4K views12:20
2023-11-30 17:05:15
#SAND/USDT
Price chart shows a
descending wedge pattern, indicating potential for an
upward breakout Key levels to watch are the
wedge breakout and liquidity pool at $1.6
12.6K views14:05
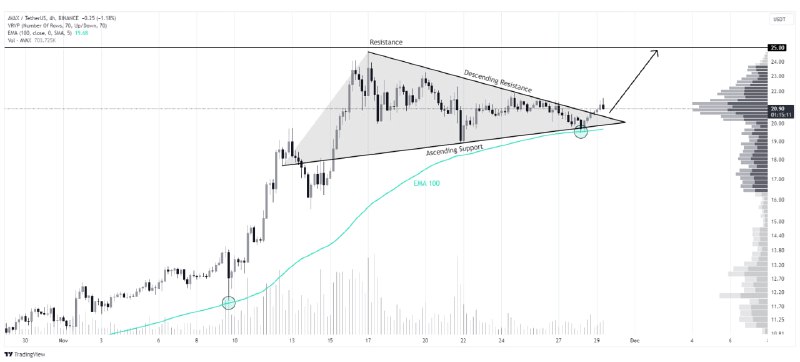
2023-11-29 18:42:32
#AVAX/USDT has been in an
uptrend since October, with
the 100 EMA acting as
support Recently price
bounced off the
100 EMA support and
broke out of a
bullish pennant pattern
Looks
bullish in the short term
18.4K views15:42