Channel address:
Categories:
Cryptocurrencies
Language: English
Subscribers:
11.24K
Description from channel
We provide only technical based charts here for alts coins as well as btc.
@Charts_Trading
We believe in charts and TA.
Contact: @Andrew_ape
Not an Investment Advice
Do your Own RESEARCH always
Ratings & Reviews
Reviews can be left only by registered users. All reviews are moderated by admins.
5 stars
2
4 stars
0
3 stars
0
2 stars
0
1 stars
0
The latest Messages 5
2023-10-01 18:04:38
$ARB
1st Target Hit
Charts | Trading & More
41.7K views15:04
2023-10-01 15:29:28
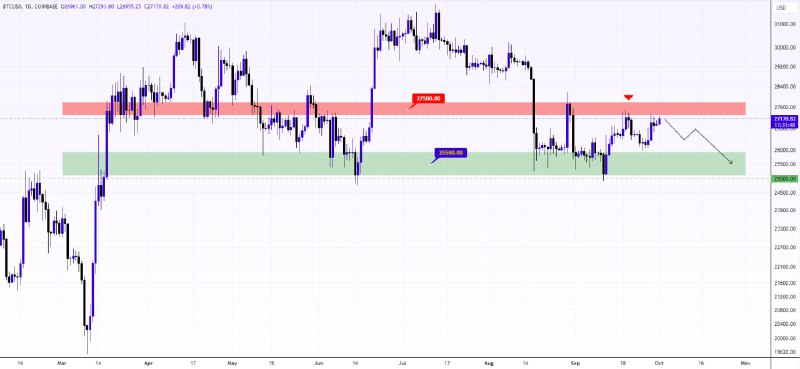
$BTC Short-Term Review
Ping Pong market to continue Invalidation if we break above
$27500 supply zone Charts | Trading & More
50.3K views12:29
2023-10-01 13:03:30
$RSR
Bullish on #RSR at this point Falling Wedge pattern is completed and I expect to switch trend once we break through the confluence of
falling wedge's resistance +
superguppy resistance Charts | Trading & More
51.5K views10:03
2023-09-30 17:55:43
$LINK Charts | Trading & More
45.3K views14:55
2023-09-30 13:14:03
$SC
It's a variety of
bullish patterns below
0.003055$ s/r zone, but all them lead us to pump
Just Send It
Charts | Trading & More
44.9K views10:14
2023-09-30 12:12:58
$ETH looks good for to switch the
Short-Term Trend Bullish Sentiment is all around MACD ready to cross bullish
Breakout through the confluence of $1700 resistance + superguppy resistance + symm. triangle Charts | Trading & More
43.6K views09:12
2023-09-29 13:18:41
What if #Dollar just bounces off
105.400 broken resistance zone Would be careful on #Crypto at this point
Charts | Trading & More
48.8K views10:18
2023-09-29 11:27:57
$BTC Local Review
It's simple here →
we have range inside the range Current scenario is to short the smaller range's top once rejection is confirmed
Alternative scenario is to long in case we break through the confluence of $27500 local supply + ema 100 Charts | Trading & More
47.3K views08:27
2023-09-28 18:40:28
$BTC is once again to face $27500 resistance zone Charts | Trading & More
37.2K views15:40
2023-09-28 12:28:43
#Dollar Mid-Term Review $DXY still really strong and ready to reach higher levels in the mid-term
Indicators:
Crossover EMA 100 on weekly (
last 10 Years it's a signal for Mid-Term Rally)
MACD Bullish Crossover (
treat it as confirmation, perfectly fits with EMA 100)
Structure:
Overall we broke through the
Multi-Year Resistance and received a rally up to 114.778 → followed by correction back to the broken multi-year resistance → re-accumulation at the resistance levels
Currently we received a break out of the re-accumulation (
descending broadening wedge) and I am targeting
Sep 2022 Swing High also coincident with
0.618 fib extension #Crypto - Not sure we receive a bullish Q4 with such Strong Dollar chart, but let's see! Anyway trade carefully Charts | Trading & More
49.0K views09:28