Channel address:
Categories:
Cryptocurrencies
Language: English
Subscribers:
9.45K
Description from channel
💰For advertising: @suppermila
Free signals 📈
Daily analytics 👨💻
Investment 💼
Ratings & Reviews
Reviews can be left only by registered users. All reviews are moderated by admins.
5 stars
0
4 stars
1
3 stars
1
2 stars
0
1 stars
0
The latest Messages
2024-06-23 09:45:52
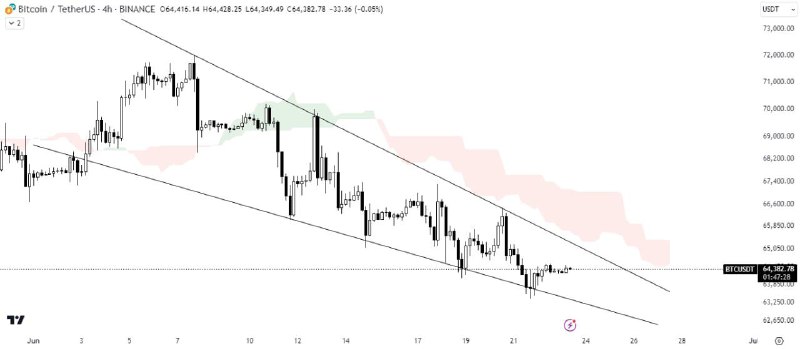
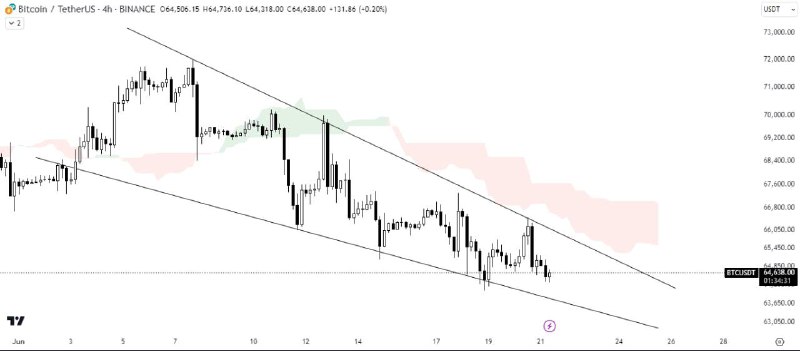
#BTC/USDT ANALYSIS
Bitcoin is currently consolidating within a falling wedge pattern, a formation often regarded as a bullish signal if a breakout occurs. Presently, the price is rebounding from the support trendline of this wedge, indicating a potential upside movement.
However, the Ichimoku cloud, positioned above the wedge, is acting as a significant resistance, impeding upward momentum.
Conversely, if Bitcoin fails to hold above the support trendline and breaks down through it, the falling wedge pattern will be invalidated. This breakdown could lead to further bearish pressure, and traders might expect a decline in prices.
3.6K views06:45
2024-06-22 09:40:56
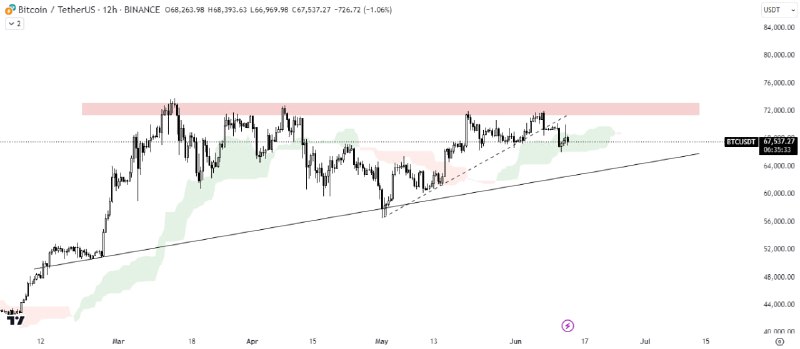
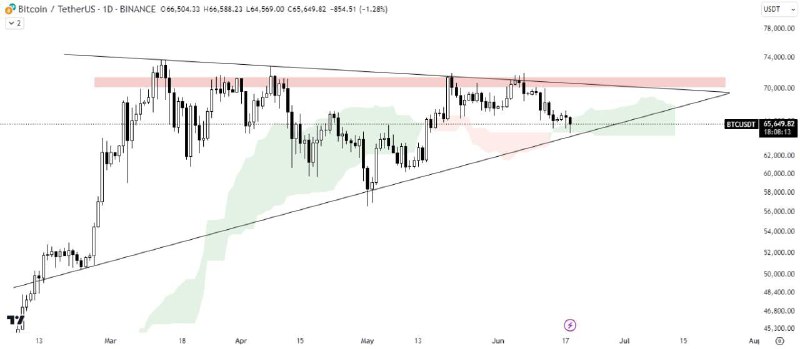
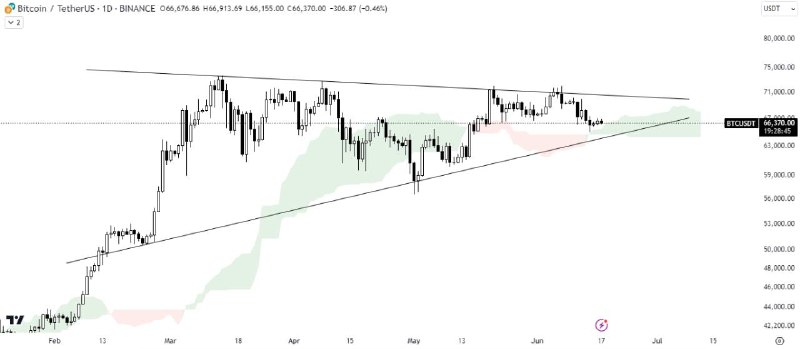
#BTC/USDT ANALYSIS
Bitcoin is currently facing rejection at the resistance trendline of the symmetrical triangle pattern, the price is close to the support trendline of the triangle. We can expect a bounce from the trendline of the triangle, with a confirmed breakout from the triangle indicating a bullish trend.
However, the Ichimoku cloud is also serving as a resistance, adding another layer of complexity to the price movement.If Bitcoin breaks down below the triangle, it would signal a bearish trend.
3.7K views06:40
2024-06-21 21:35:45
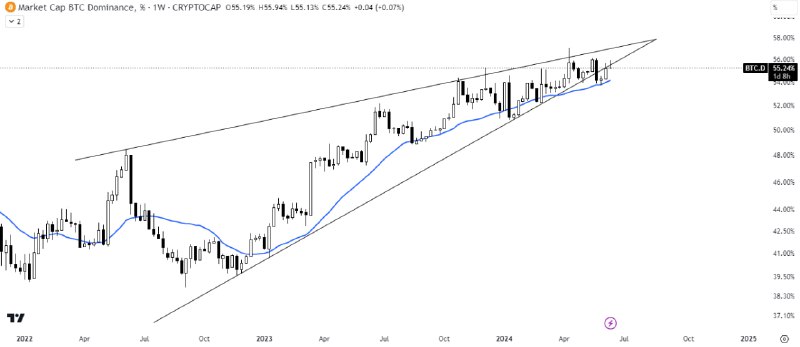
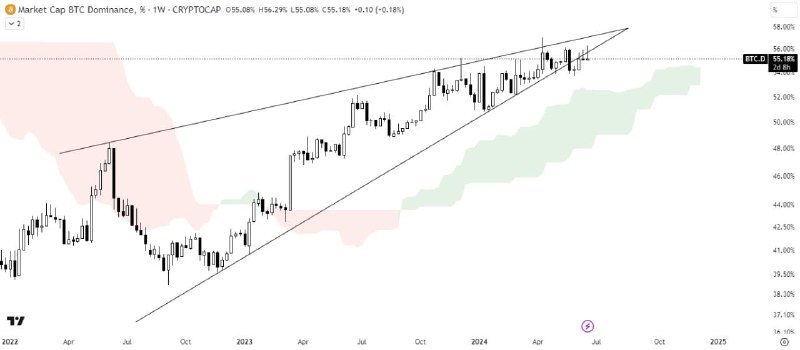
#BTC DOMINANCE ANALYSIS
BTC.D recently broke down from a rising wedge pattern on the weekly timeframe, indicating the potential for further decline. It is currently retesting the wedge's lower boundary.
If this retest fails and BTC.D drops below the Ichimoku cloud, a significant decline could ensue, potentially triggering a strong bullish rally in the altcoin market.
3.5K views18:35
2024-06-21 15:21:15
#WIF/USDT ANALYSIS
WIF is currently trading above the horizontal demand zone of a descending triangle. This suggests a potential bounce, with a breakout of the pattern confirming a bullish trend.
However, the Ichimoku cloud is also acting as resistance.
Conversely, a break below the triangle could signal a downward movement.
3.4K views12:21
2024-06-21 10:01:15
#BTC/USDT ANALYSIS
Bitcoin is consolidating within a falling wedge chart pattern and has recently been rejected from the resistance trendline of the wedge.
Additionally, the Ichimoku cloud is acting as resistance above the pattern. A successful breakout from the wedge would serve as bullish confirmation.
Conversely, if Bitcoin breaks down through the support trendline of the wedge, the pattern will be invalidated.
3.6K views07:01
2024-06-20 14:00:54
Binance Will Support the Fetch .ai (FET), Ocean Protocol (OCEAN) and SingularityNET (AGIX) Token Merge
https://www.binance.com/en/support/announcement/e485541c370240adba3929fded74f269
3.4K views11:00
2024-06-20 10:10:56
#BTC/USDT ANALYSIS
Bitcoin is gaining momentum from the support trendline of an ascending triangle, suggesting a potential bounce. A breakout above the triangle would confirm a bullish trend.
Additionally, the Ichimoku Cloud is providing support, further indicating bullish momentum.
Conversely, a breakdown below the triangle's support trendline would signal a bearish trend.
3.6K views07:10
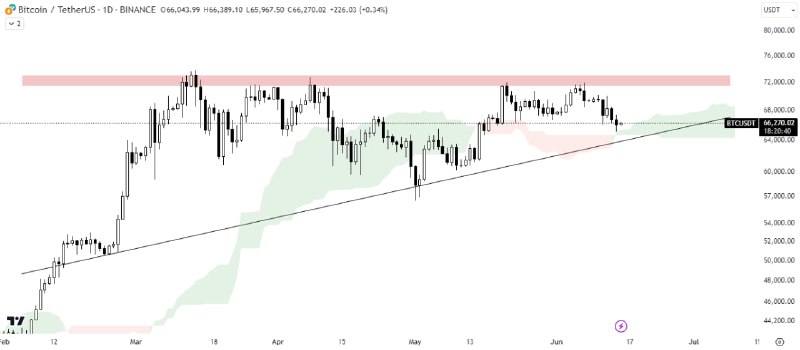
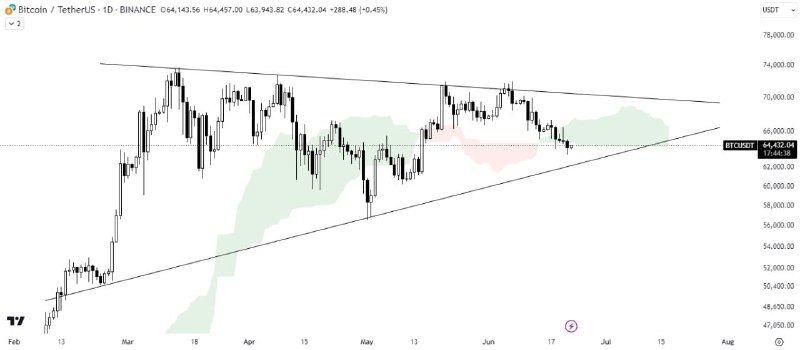
2024-06-18 09:56:19
#BTC/USDT ANALYSIS
Bitcoin is currently navigating a symmetrical triangle pattern, positioned within the Ichimoku cloud, indicating a phase of consolidation. We anticipate a bounce from the support trendline of the triangle, suggesting a potential short-term buying opportunity.
The key focus is on a breakout from the triangle and the horizontal resistance zone, which would signal bullish momentum and the possibility of a significant price increase.
Conversely, a breakdown below the support trendline and the Ichimoku cloud could trigger a market correction, indicating bearish control and potential further declines.
3.7K views06:56
2024-06-17 14:16:08
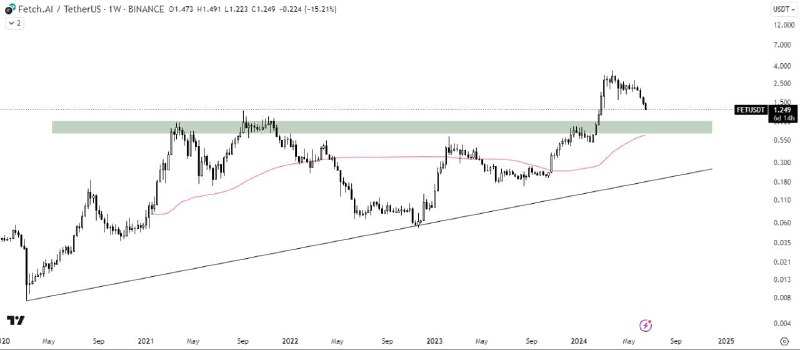
#FET/USDT ANALYSIS
FET has broken out of the ascending triangle with significant volume, indicating potential bullish momentum. It is currently retracing for a retest. A successful retest would confirm the bullish trend.
Additionally, the 100-day moving average is acting as support below the horizontal resistance zone of the triangle. We should wait for further price developments to determine the next move.
3.4K views11:16
2024-06-17 08:36:30
#BTC/USDT ANALYSIS
Bitcoin is currently consolidating within a symmetrical triangle pattern and trading above the Ichimoku cloud, which is providing support. A bounce from the support trendline of the triangle is anticipated.
A breakout from the triangle would signal bullish momentum, while a breakdown could lead to a market correction.
3.6K views05:36